


Volume Profile Explained - How I Use It For Scalping
Breaking down my favourite order flow tool and how I use it to scalp - every single day.
In my experience, the Volume Profile is the single most effective order flow tool - excluding the DOM.
It is the backbone of my scalping strategy that I employ every single day on the ES, and if I had to choose only one order flow tool to use…
It would be the Volume Profile by a long shot.
In this article, I will explain the mechanics of the Volume Profile, and then break down how I use it to inform my daily levels of interest and scalps.
Volume Profile Introduced & Explained:
The volume profile represents trading activity at each price level, irrespective of time.
If you remember from last weeks article; the depth of market (DOM) shows passive limit orders, or intent of traders.
The volume profile however, shows how much business is actually executing or transacting at each respective price.
This helps us to understand what areas of price has the most interest from both buyers and sellers, i.e. fair value.
Think of the volume profile as a visual representation of transactions for a product.
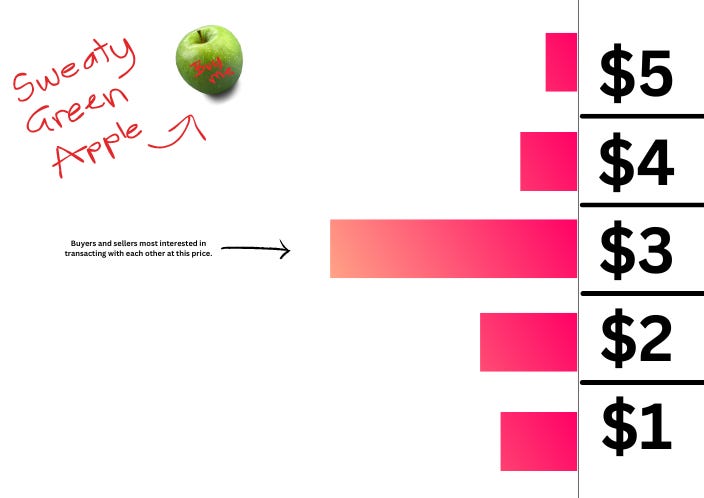
Imagine you were given a dataset showing sales data for the sweaty green apple market.
You can see that at a price of $3, there is an abundance of both buyers willing to buy, and of sellers willing to sell at this level.
However:
Below $3, sellers start to lose interest as indicated by lesser volume
Above $3, buyers start to lose interest as indicated by lesser volume.
Therefore we can logically conclude that the fair value of a sweaty green apple is $3.
If we were to sell these apples for $3, there would be no shortage of demand.
And if we were to seek to buy an apple at $3, there would be no shortage of supply.
Reading the Volume Profile:
The first important thing to look for on a volume profile is the Point of Control (POC) and High Volume Nodes (HVN).
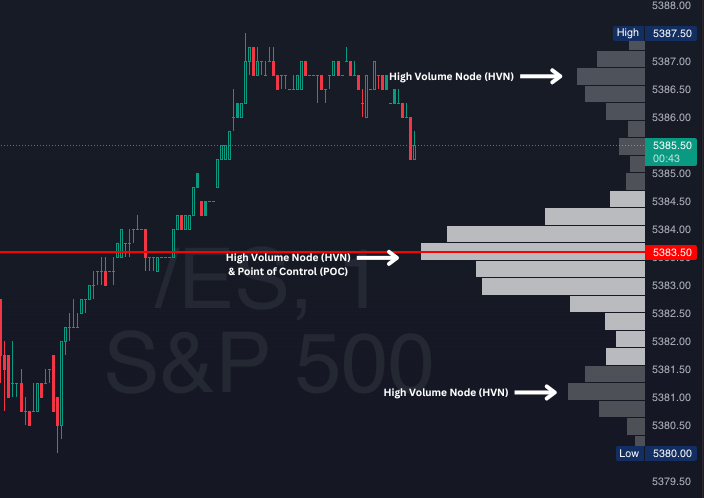
The POC is the price that the market has had the most transactions at, and can be considered fair value.
Both buyers and sellers willing to engage at this price, and the POC is normally indicated by a red line extended out to the left.
Notice how there are also other levels above and below fair value that create “shelfs” in the volume profile?
Those are called High Volume Nodes, or HVN.
These are areas that have a decent amount of engagement from both sides as well, but are skewed out above and below fair value.
As price moves up or down away from the current POC, these HVNs often develop into the new POC as the market is seeks new levels of fair value as the day progresses.
Both the POC and the HVN can be used as “support” and “resistance” levels, as the market is less likely to immediately break through these levels.
Since price is less likely to blow through the POC or HVN, they provide good potential entries for scalpers.
My bread and butter scalping setup is looking for “bounces” from both the POC or HVN for 2-10 ticks (depending on the session volatility) at a time.
If above the POC/HVN, I look to take longs, and if below, shorts.
It’s not always the best idea to just blindly enter at these levels, I also use the DOM and another tool called “delta” (which we will look at next week) to help confirm my entries - but all of my trades are executed at or near the POC and HVN.
Setting It Up:
So how do I set it up on my charts every day, and what levels am I marking out?
I actually use the Volume Profile in two different ways:
One for higher time frame levels of interest
One for the “now” or very recent price action to scalp in between
I’ll first show you how to set up the Volume Profile for my daily higher time frame levels:
(Note, I am using “TopstepX” as my platform of choice.)
Higher Time Frame Daily Levels:
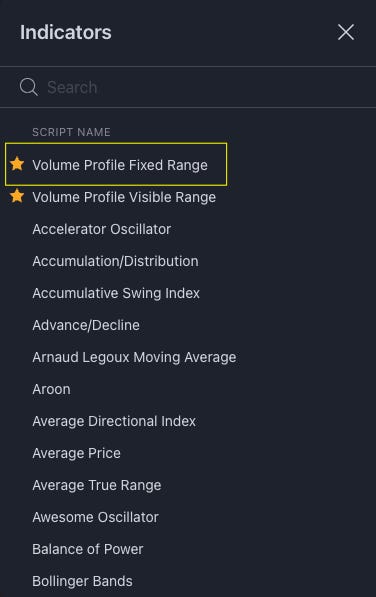
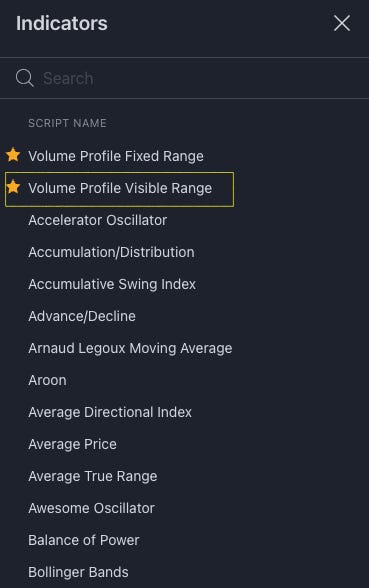
In TopstepX or TradingView, under “Indicators”, select “Volume Profile Fixed Range”:
Once you’ve selected the indicator, you will be able to draw a range for the Volume Profile.
Draw the range across the previous trading day from 12.00am EST to 12.00am EST.
Extend a line out into your current trading day for the previous day POC (PDPOC)
Extend a line out into your current trading day from the top of the highlighted range, known as the previous day Value Area High (PDVAH)
Extend a line out into your current trading day from the bottom of the highlighted range, known as the previous day Value Area Low (PDVAL)
These are your higher timeframe levels of interest for each day.
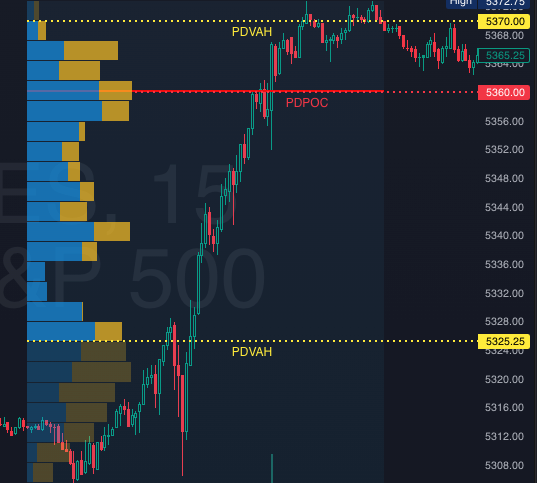
The PDPOC often acts as an important support/resistance level as explained earlier.
The PDVAH and PDVAL represent the high and low of the “value area” (the value area is the highlighted/non-faded range in the Volume Profile that represents where 70% of trading volume was conducted).
PDVAH and PDVAL often act as levels of support and resistance or reversal areas, so I like to keep an eye on these too.
I use these higher time frame levels in two ways:
To find scalping opportunities when we reach these points in price.
To inform my shorter-term levels.
Short-Term Scalping Levels:
Now obviously the above only marks out 3 levels of interest for the day, but as a scalper - I’m not sitting around all day to wait for these levels to be traded into.
I also have short term levels based on the same principles we discussed earlier in which I take trades from.
For the short-term levels, I am trading the most recent price action volume (previous 10-30 mins worth of volume information.)
For this one, in TopstepX or TradingView, under “Indicators”, select “Volume Profile Visible Range”:
This will display the volume profile for whatever the visible range is that you have on your chart (basically how “zoomed in” or “zoomed out” you are).
I like to use the 30 second chart and have my screen zoomed in to the last 10-30 minutes worth of price action .
(Depending on volatility… low volatility = zoomed out for more data, high volatility = zoomed in.)
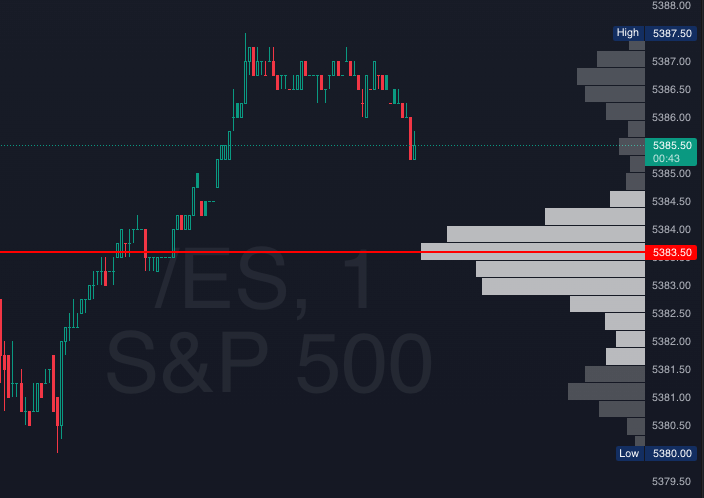
Here’s what it looks like:
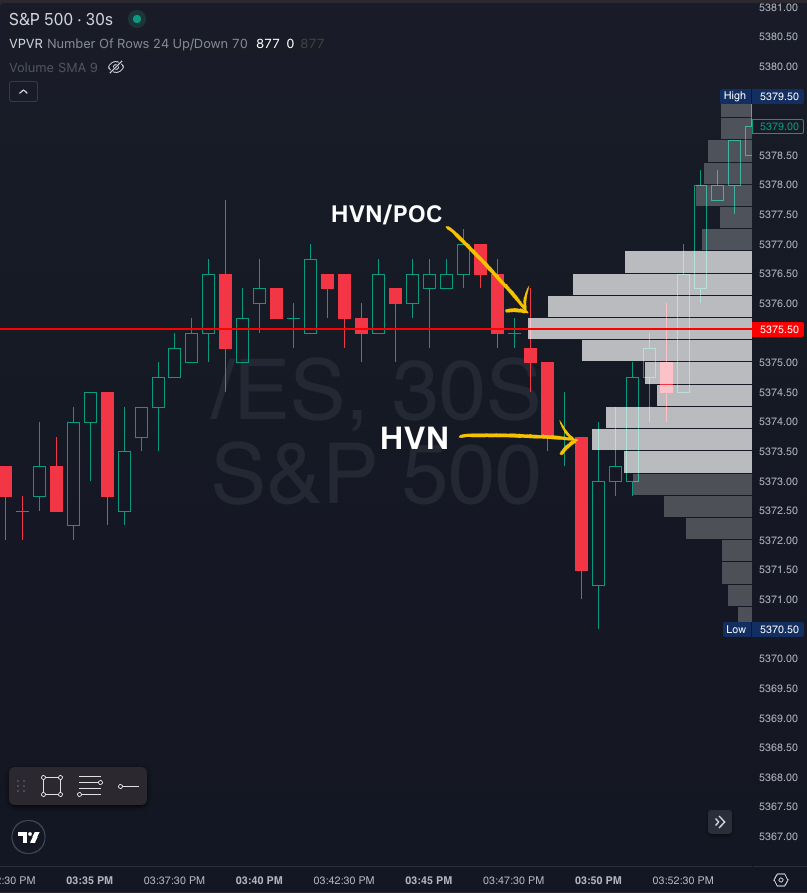
I trade long from above, and short from below (with confirmation from the DOM and delta). But even without that - look how many times price bounced from above the POC.
Of course, this screenshot is hindsight and cherry picked. But add this to your chart and go back and see how many times these HVNs are used as support/resistance.
Note: Whilst I mostly trade from these shorter term levels, if we trade into the high time frame areas marked out earlier - I consider those “higher probability” levels to trade from.
I also don’t want to “counter trade” the higher time frame levels (e.g. don’t go long when immediately below the PDPOC)
Conclusion
Note: This is strictly not financial advice, do your own research. I am simply sharing how I like to trade using this tool. Neither is this a holy grail system, your results may vary.
Using the Volume Profile this way, I discretionarily scalp the markets up and down for roughly two hours per day across my seven accounts (six prop. firm accounts and one personal account - not copy trading, I trade each one individually to spread my risk).
Each account sees about 14 trades on average.
I like to stop when I reach +$300 or -$300 using 1-2 contracts per setup and aiming for 2-4 ticks per trade on the ES.
This is a high frequency style of trading and is not for everyone, but it’s what I found is my personal sweet spot.
Some people like to take larger swings rather than taking a few ticks at a time, others like to trade the higher time frame levels only, and some like to aim for bigger trades with less frequency.
At the end of the day, you need to figure out what style works for you.
However you end up using this information is up to you - but I hope this article helped you to further understand the Volume Profile and see how it can be beneficial no matter your style of trading.
Catch you next week!
~Cammy Capital
Discount Links:
Futures Trading Prop Firm I Use + TopstepX Platform (20% Discount)
Footprint Charts I Use ($15 Discount)